Moflow+

Projections: your net worth, decades ahead.

Built from your accounts, savings and goals, as a band from pessimistic to optimistic.

Try Moflow+

Moflow+ · $199 per year

An estimate from assumptions you supply, not a forecast. Not investment advice — decisions are yours.

  1. Pessimistic to optimistic

    A band around the curve, and your goals pinned where they fall.

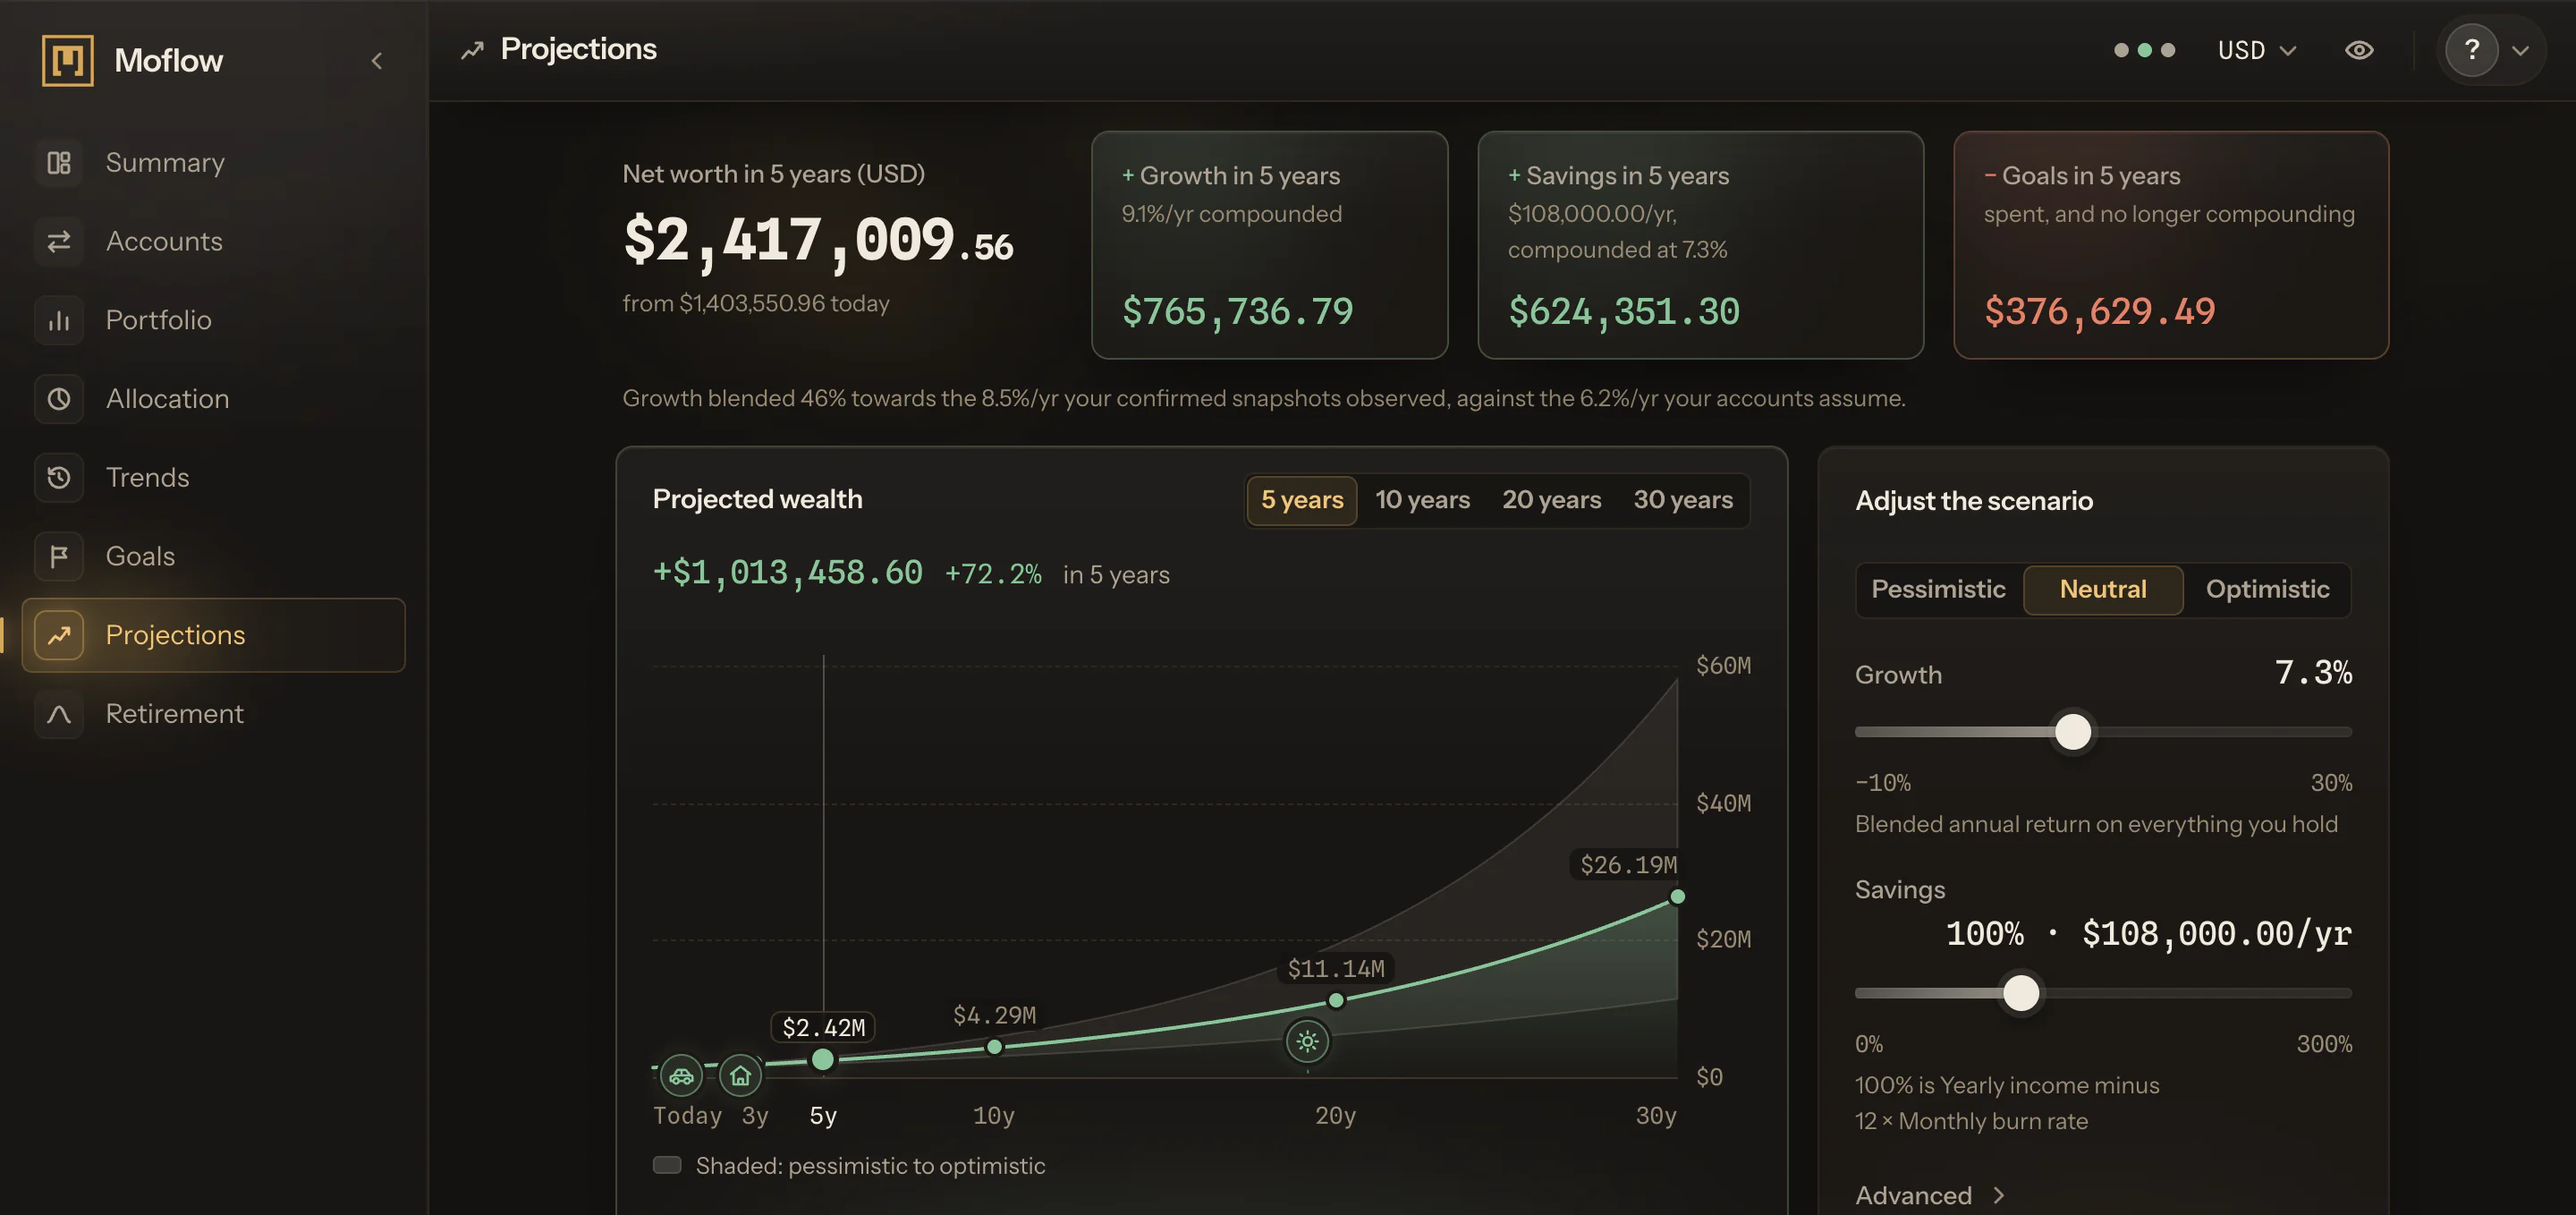
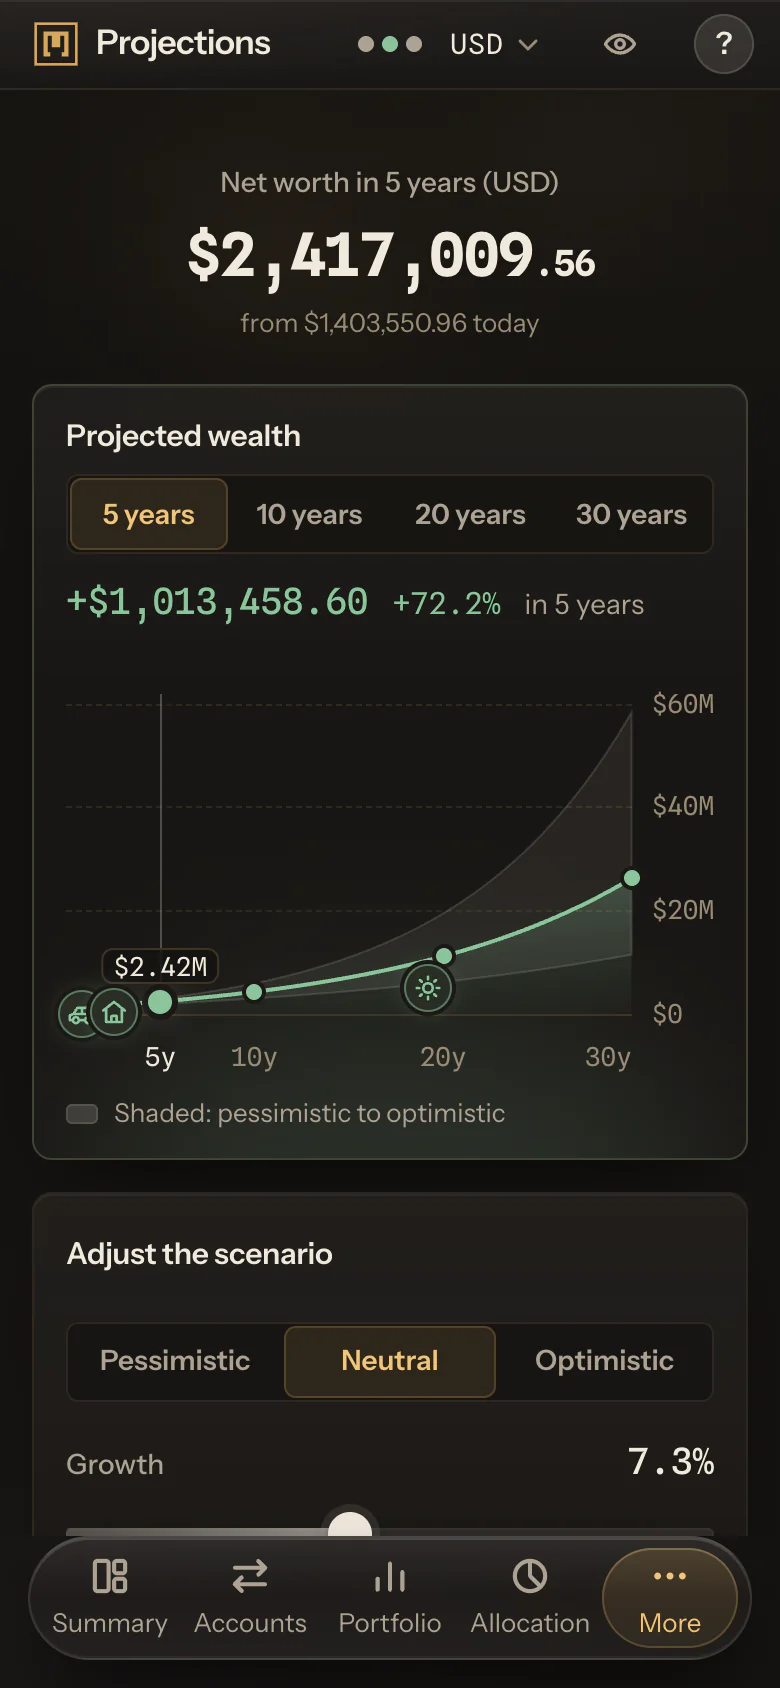
    In the frame, the curve runs decades ahead, with the band shaded around it and goals marked where they fall. The curve starts from today's net worth.

    Each asset class grows at the rate your accounts carry, and each year's net savings, your yearly income minus twelve months of burn, is added and grows with it. Debts are subtracted at what they owe today.

    The band around the curve runs from a pessimistic case to an optimistic one, so the answer reads as a range. Neither end is a limit: a result can fall outside the band.

    Pick a horizon, and the page shows the neutral figure, the band around it, and how much of it comes from your savings. Every figure is in your display currency, and a goal in another currency is converted to sit on the curve.

  2. Change the assumptions

    Pick pessimistic, neutral or optimistic, or set growth and savings yourself.

    Pessimistic takes 3 points off the growth rates and saves 20% less; optimistic adds 3 points and saves 20% more. Or set growth and savings yourself, and the curve, the band and your goals move together.

    The three cases use the same accounts and the same goals.

    Savings shows as a share and an amount a year: 100% is your yearly income minus twelve months of burn. Set how much of your savings is reinvested, and the rest is kept as cash that adds to your wealth without growing.

    Changing any of these leaves your accounts as they are. Try a case and see what moves; your ledger stays as it was.

  3. Projected vs actual

    Your confirmed months against the projection, to see how it held up.

    A confirmed month is set against what the projection said for it, as an amount and a percentage. In the frame, a year of confirmed months runs beside the projected line, with the gap above it.

    From 3 confirmed months on, the growth your net worth showed is blended into the growth assumption. It never rewrites your income or your burn rate.

    With fewer, the projection runs on the returns you gave your accounts. Over time, the projection is measured against what your months turned out to be.

A worked example: ten years, three cases

One ledger, three cases, ten years. Start with 300,000 USD growing at 5% a year, a yearly income of 120,000 USD and a monthly burn rate of 8,000 USD.

That is 24,000 USD of net savings a year, added at each year's end and growing at the same 5%.

CaseGrowthSavings a yearIn ten years
Pessimistic2%19,200 USDabout 575,933 USD
Neutral5%24,000 USDabout 790,538 USD
Optimistic8%28,800 USDabout 1,064,890 USD

Of the neutral figure, about 488,668 USD comes from today's 300,000 growing, and about 301,869 USD from ten years of savings and their growth.

The band at year ten runs from about 575,933 to about 1,064,890 USD, and its top is almost twice its bottom.

The savings side is easy to isolate. At 5%, each extra 1,000 USD saved a year adds about 12,578 USD by year ten.

The pessimistic case is not a worst case: it is the neutral one with less growth and less saving. These figures are an estimate from the assumptions above, not a forecast.

How do I project my net worth?

Start from today's net worth, grow each asset class at its rate, and add each year's net savings with their growth. Moflow does this from your accounts, your income and your burn rate, and draws it decades ahead.

The neutral case is the middle of the band.

Can I project net worth from income and spending, without tracking every expense?

Yes. Moflow needs a yearly income and a monthly burn rate, not a list of what you spend.

Their difference is your net savings, the figure the projection adds each year. Not an accounting tool: no receipts and no per-expense tracking.

Where does the growth rate come from?

From the returns you give your accounts, weighted by how much is in each, so a large account at 6% moves it more than a small one at 2%.

From 3 confirmed months on, Moflow blends in the growth your net worth showed.

Do debts count in a projection?

Yes. What your debts owe today is subtracted from the curve, at today's amount, at every point ahead.

A payment you record later shows in the next projection.

What is projected vs actual?

Your confirmed months set against what the projection said for them, as an amount and a percentage. It shows how close the assumptions have been to the months you actually recorded.

A month above the line came in ahead of the assumptions; a month below came in behind them.

Is a projection a forecast?

No. Projections show what your own figures and confirmed months imply, never what a market will do.

Projected vs actual shows how close it has been, and the decisions are yours.

The ledger is free. Moflow+ projects it.

Trends, goals, projections and retirement, drawn from the same ledger.

Try Moflow+

Moflow+ · $199 per year